Click here for Wildfire Resources
District Information
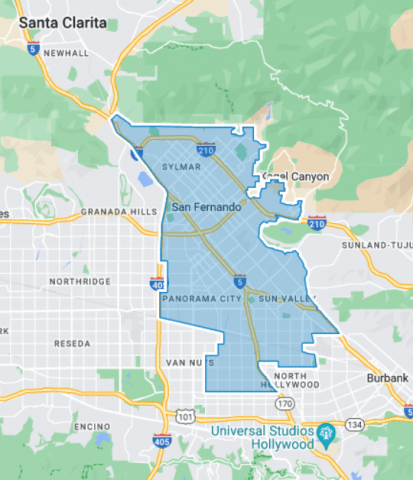
DISTRICT AD43
2020 Census Population (adj Elec. §21003)
| Name | Count | Percent |
|---|
| Total Population (POP) | 508,082 | 100.00% |
|---|
| POP Hispanic or Latino | 365,106 | 71.86% |
|---|
| POP Not Hispanic or Latino (NH) | 142,976 | 28.14% |
|---|
| POP NH Population of one race | 136,215 | 26.81% |
|---|
| POP NH White alone | 78,365 | 15.42% |
|---|
| POP NH Black or African American alone | 15,240 | 3.00% |
|---|
| POP NH Asian alone | 38,794 | 7.64% |
|---|
| POP NH American Indian and Alaska Native alone | 863 | 0.17% |
|---|
| POP NH Native Hawaiian and Other Pacific Islander alone | 391 | 0.08% |
|---|
| POP NH Some Other Race alone | 2,562 | 0.50% |
|---|
| POP NH Population of two or more races | 6,761 | 1.33% |
|---|
2020 Census Housing Occupancy Status
| Name | Count | Percent |
|---|
| Total Housing Units | 143,749 | 100.00% |
|---|
| Occupied | 139,991 | 97.39% |
|---|
| Vacant | 3,758 | 2.61% |
|---|
2020 Census Group Quarters Population (adj Elec. §21003)
| Name | Count | Percent |
|---|
| Total Group Quarters Population: | 7,142 | 100.00% |
|---|
| Institutionalized population: | 2,283 | 31.97% |
|---|
| Correctional facilities for adults | 79 | 1.11% |
|---|
| Juvenile facilities | 273 | 3.82% |
|---|
| Nursing facilities/Skilled-nursing facilities | 1,899 | 26.59% |
|---|
| Other institutional facilities | 32 | 0.45% |
|---|
| Noninstitutionalized population: | 4,859 | 68.03% |
|---|
| College/University student housing | 25 | 0.35% |
|---|
| Military quarters | 0 | 0.00% |
|---|
| Other noninstitutional facilities | 4,834 | 67.68% |
|---|
Counties In District
| Name | Count | Percent |
|---|
| Los Angeles | 508,078 | 5.06% |
|---|
Places In District
| Name | Count | Percent |
|---|
| LOS ANGELES: Los Angeles(C) | 483,371 | 12.36% |
|---|
| LOS ANGELES: San Fernando(C) | 24,055 | 100.00% |
|---|
| LOS ANGELES: Remainder of Los Angeles(R) | 652 | 0.74% |
|---|
